Skip over navigation


Chi-squared Faker
Age 16 to 18
Challenge Level 

The profile of the expected and observed distributions
is
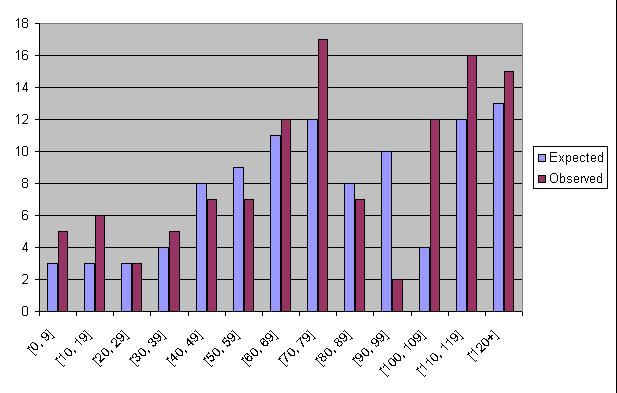
We could explain the expected profile as the right two peaks are the adult male weights, the preceding peaks are due to adolescent males. To see better, we would need to superimpose a male weight profile on top of a female weight profile.
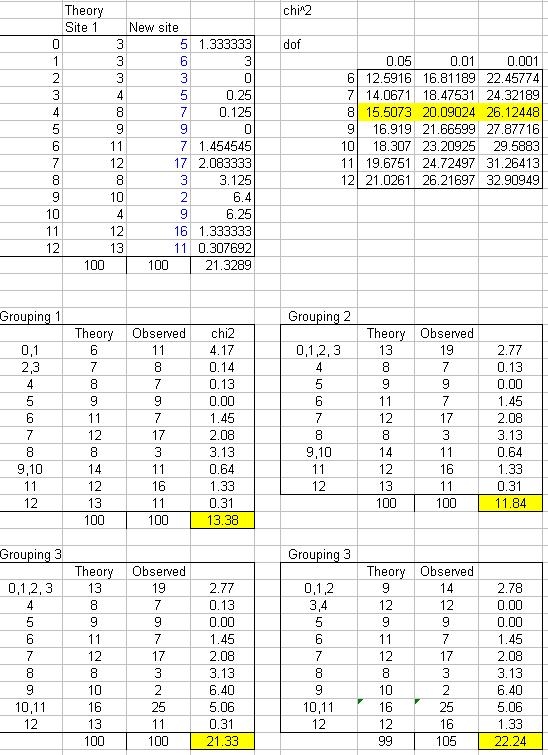
To make a $\chi$-squared test pass we want to group data which reduces the overall statistic. To do this we would try to group a class which is an over-estimate with a class which is an under-estimate.
To make it fail, we would want to increase the statistic. To do this we would group together classes which are over-estimates and group together classes which are under-estimates.
Obviously, we would want to group classes in ways which look reasonable!
We looked at these ways to group the data:
We could explain the expected profile as the right two peaks are the adult male weights, the preceding peaks are due to adolescent males. To see better, we would need to superimpose a male weight profile on top of a female weight profile.
To make a $\chi$-squared test pass we want to group data which reduces the overall statistic. To do this we would try to group a class which is an over-estimate with a class which is an under-estimate.
To make it fail, we would want to increase the statistic. To do this we would group together classes which are over-estimates and group together classes which are under-estimates.
Obviously, we would want to group classes in ways which look reasonable!
We looked at these ways to group the data:
You may also like
Chance of That
What's the chance of a pair of lists of numbers having sample correlation exactly equal to zero?