Skip over navigation


Whose Line Graph Is it Anyway?
Age 16 to 18
Challenge Level 

Why do this problem?
This problem requires students to engage with the relationship between algebra, graphs and the physical processes from which they are derived. There is a strong modelling aspect to the problem which requires students to relate the decimal numbers in the expressions to key physical concepts.
Possible approach
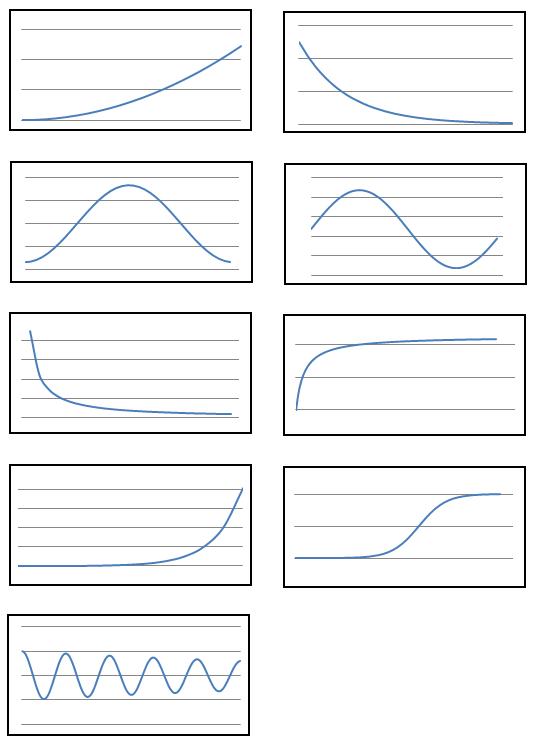
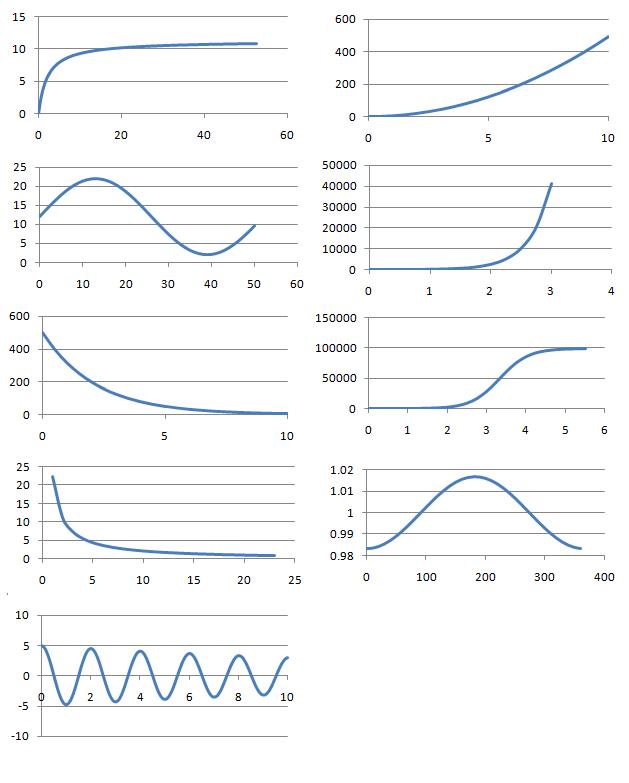
This is well-suited to a card sorting approach. You can use these printouts of the equations, the graphs without axes , the graphs with axes and the processes. There is quite a lot of information for students to grapple with at the start of the problem and initially they might try to get a feel for the structure of the problem before attempting to pair cards together.
The simplest way into the problem is first to match the graphs and equations and then to match the processes onto these. Matching equations and graphs by a process of elimination is a good idea and students will need to realise that substituting $x=0$ or $x$ equal to the largest value on the horizontal axis is the best way to do this.
Students should be encouraged to try to get into the equations by looking at key points on the graphs (such as turning points, roots, asymptotes) and then deciding whether this might link well with a physical process.
Of course, some parts can be matched by process of elimination. However, the problem could be taken one step further: once students are confident that they have matched a process, graph and equation they should think about the match more carefully. Can they provide several different numerical/visual/physical common sense checks that the match is correct?
The most challenging aspect of the problem is deciding on the origin of the unusual-looking numbers, such as $3.13$ or $0.01671$. Reinforce to students that most of the numbers do result naturally from the physical process: all of the long decimals have an 'obvious' scientific origin. However, uncovering this origin will require students to think carefully about the physical process; there
will doubtless be gaps in their scientific knowledge which make it likely that they will only be able to understand some of these fully.
Key questions
How might you rule out certain pairs of graphs and equations?
Where are the key points on each graph?
For each process, roughly what shape graph would you expect? Which graphs or equations might be consistent with this?
Once you have matched a process, equation and graph how would you construct very convincing evidence that the match is correct?
Possible extension
At a higher level, students might question the modelling assumptions giving rise to the graphs and equations. First they will have to work out what modelling assumptions were made; then they can challenge any or all of these.
Possible support
The introductory task What's That Graph has the same structure but uses processes with a simpler functional form.
Suggest that students try to substitute the values $x=0$ and the largest value on the horizontal axes of the graphs into the equations. Which match up?
Suggest that students try to substitute the values $x=0$ and the largest value on the horizontal axes of the graphs into the equations. Which match up?
You may also like
Power Up
Show without recourse to any calculating aid that 7^{1/2} + 7^{1/3} + 7^{1/4} < 7 and 4^{1/2} + 4^{1/3} + 4^{1/4} > 4 . Sketch the graph of f(x) = x^{1/2} + x^{1/3} + x^{1/4} -x