Or search by topic
Number and algebra
Geometry and measure
Probability and statistics
Working mathematically
Advanced mathematics
For younger learners
Mach Attack


A moving aeroplane is constantly hitting gas molecules, causing compression waves which move away from the aeroplane at the speed of sound.
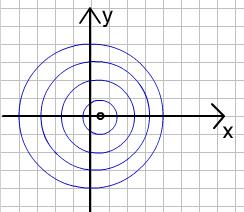
If we simplify an aeroplane as a small, slowly moving particle that produces sound waves in all directions, then a 2D slice of the wavefronts in the $(x, y)$ plane would look like almost concentric circles, as follows:

An aeroplane moving slowly, relative to the speed of sound
The speed of aeroplanes is measured in units of Mach $-$ Mach $1$ is the speed of sound, Mach $0.5$ is half the speed of sound, Mach $2$ is twice the speed of sound, and so on.
In the context of sound waves, why is Mach $1$ important?
Can you accurately draw the location of various wave fronts around the plane at Mach $0.5$? What about Mach $1$? What about Mach $2$?
What would the situation be for a typical commercial airplane?
Tip: A pair of compasses would help you to draw clearer circles.
With aircraft travelling above the speed of sound, the full 3D boundary of all of the wavefronts forms a simple solid shape. Can you find a way to describe this shape algebraically in terms of $v$ (the speed of the aeroplane) and $c$ (the speed of sound)? (Note that this shape is often visible around fast moving aircraft)
What goes wrong with the description of your shape for aircraft speeds slower than the speed of sound?
Aside: You can still make sense of this shape using complex numbers, although it does not 'exist' as such. You might like to investigate this idea to test out your skill with complex numbers. For example, how does the result relate to the physical situation? See the solution for more details.
Extension: You might like to think about the patterns of wavefronts for aircraft moving along curved trajectories.
You may also like
Overarch 2
Bricks are 20cm long and 10cm high. How high could an arch be built without mortar on a flat horizontal surface, to overhang by 1 metre? How big an overhang is it possible to make like this?
Stonehenge
Explain why, when moving heavy objects on rollers, the object moves twice as fast as the rollers. Try a similar experiment yourself.
Maximum Flow
Given the graph of a supply network and the maximum capacity for flow in each section find the maximum flow across the network.

