Population Dynamics - Part 3


The Logistic Equation
Unlimited growth is generally impossible, because birth and death rates are affected by factors such as lack of food, water and land. We now incorporate the effect of the environment on population size into the exponential model: $\frac {\mathrm{d}N}{\mathrm{d}t} =rN(t)$
Below are two derivations of this new model, called the logistic equation. It was originally devised by the mathematician Thomas Malthus. Notes on the discrete form of this equation can be found here.
First Derivation
The carrying capacity, K, is the largest population that can be supported indefinitely, given the resources available in the environment. When the population size is far below K, its growth is exponential. As the population approaches K, it begins to be affected by the reduced ability of the environment to provide necessary resources.
In order to have this effect, we consider the term $\frac {K-N}{K}$ . Note that when $N< < K$ then $\frac {K-N}{K}\approx 1$ and when $N \rightarrow K$ then $\frac {K-N}{K} \rightarrow 0$.
Including the above term, we now get the equation: $$\frac {\mathrm{d}N}{\mathrm{d}t}=r \frac{K-N}{K} N(t)= rN\left(1-\frac{N}{K}\right)$$Note that each individual added to the population reduces the rate of increase of the whole population.
Second Derivation
Consider a population of lions of size y, and begin by assuming the simple exponential equation $\frac {\mathrm{d}y}{\mathrm{d}t}=r y$ , where r is the intrinsic growth rate.
If the probability of food being found by an individual lion is y, then the probability of some food being found by two lions is proportional to $y^2$. Fighting will occur within the species for these limited resources, so the death rate due to fighting can be represented by $\gamma y^2$ . Our equation then becomes: $$\frac {\mathrm{d}y}{\mathrm{d}t}=ry-\gamma y^2=ry\left(1-\frac{y}{Y}\right)$$where $Y=\frac{r}{\gamma}$. Again this is the logistic equation.
Question: Graph the logistic equation to find the equilibrium points. Then solve the equation using standard integrals, showing that the solution is given by $N(t)=\frac {K N_0 e^{rt}}{K+N_0 (e^{rt}-1)}$
Graphically we describe this kind of population growth by a sigmoid, or S-shaped growth curve:
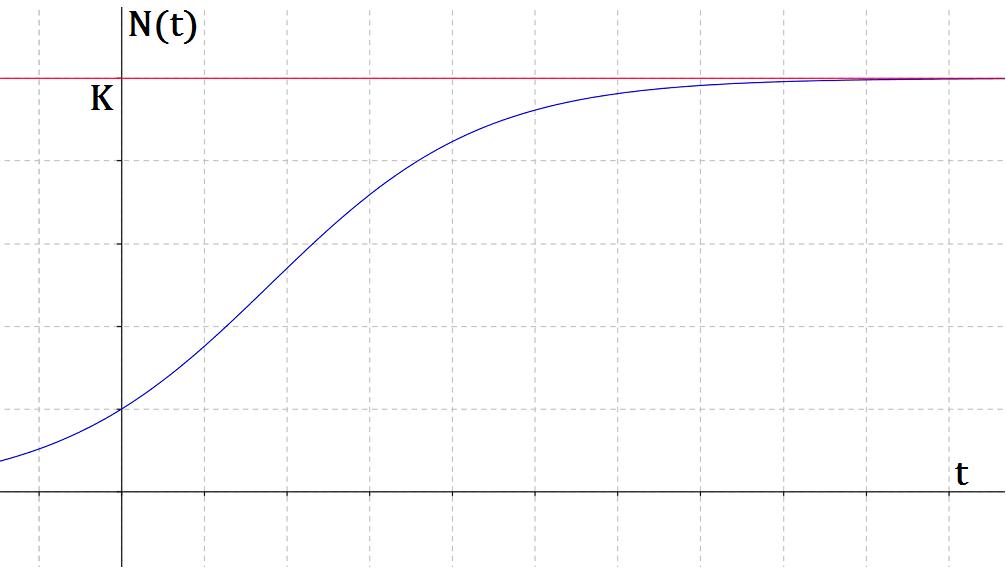
By looking at the blue curve, we see the size of the population begins to level off and reaches a stable value, which must be less than the carrying capacity of the environment (marked in red).
Mathematically, we can show this by looking at the above solution for $N(t)$ and showing $\lim_{t\to\infty} N(t)=K$
Question: A small lake has a carrying capacity of 100 geese. Starting with a pair of geese, how would the population change over 70 years if $r=0.1$? Draw a sigmoid graph of this change.
Recall that r is the intrinsic growth rate. How will this affect the time taken for the number of geese to reach the carrying capacity of the lake? Perhaps start by drawing graphs with different r-values.
Related Collections
You may also like
Ball Bearings
If a is the radius of the axle, b the radius of each ball-bearing, and c the radius of the hub, why does the number of ball bearings n determine the ratio c/a? Find a formula for c/a in terms of n.
Overarch 2
Bricks are 20cm long and 10cm high. How high could an arch be built without mortar on a flat horizontal surface, to overhang by 1 metre? How big an overhang is it possible to make like this?
Cushion Ball
The shortest path between any two points on a snooker table is the straight line between them but what if the ball must bounce off one wall, or 2 walls, or 3 walls?