Different Deductions


Different Deductions
If you are a teacher, click here for a version of the problem suitable for classroom use, together with supporting materials. Otherwise, read on...
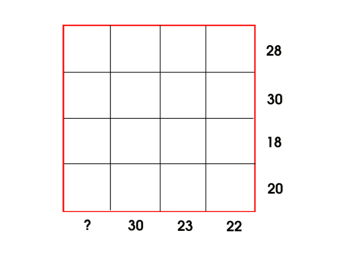
Each symbol has a numerical value. The total for the symbols is written at the end of each row and column.
Can you find the missing total that should go where the question mark has been put?

What can you deduce from each image?
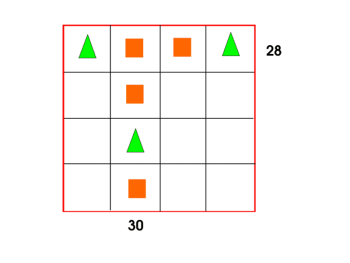
Image 2

Image 3
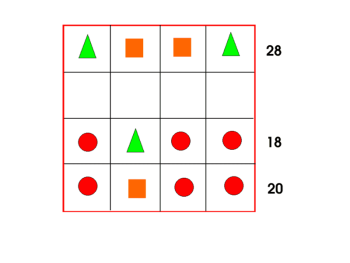
Image 4
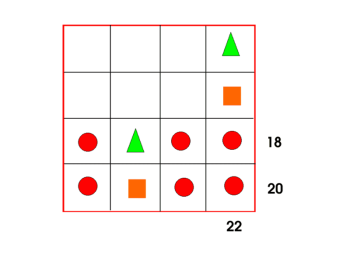
Image 5
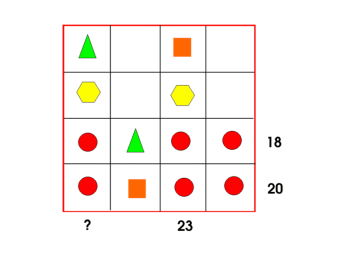
Image 6
Why do this problem?
This problem provides a fantastic opportunity for learners to articulate their reasoning and could introduce them to the idea of redundant information. It is also offers a context in which to become familiar with the idea of a symbol representing an unknown quantity which is a key idea in algebraic thinking. (If you are using
this task with older students, beyond the primary age range, you may wish you look at the secondary version of these notes.)
Drawing attention to particular parts of the grid makes different ways of approaching this task explicit. Giving children the chance to discuss these different methods means they can add them to their mathematical 'toolkit' and encourages them to be more resilient mathematicians, shifting the focus away from the answer to the journey towards a solution.
Possible approach
Display this grid on the screen for everyone to see:
Allow a few minutes for children to look at the image and consider what they see. Suggest that they share ideas with a partner before taking some comments as a whole group. Invite anyone in the room to respond and use this process to 'set the scene'.
Pose the problem orally, and/or by handing out this sheet, or displaying this PowerPoint slide. Explain that this is a particularly interesting problem because it can be solved in lots of different ways. Give pairs time to begin to tackle the task, but after a few minutes, hand out this sheet, containing six different images, suggesting different starting points. The images are also available on these PowerPoint slides.
Reassure the group that there is a lot of information in the grid, so they had to make some choices about what to focus on first. Explain that each image on the worksheet draws attention to particular parts of the grid. What can they deduce from each? How can each help them to solve the problem?
Warn everyone that in a while, you're going to invite pairs up to the board to explain how they would use a chosen image to find the missing total. (The worksheet is set out so if you don't want everyone to work on every image, you can give half the class the odd numbered images and half the class the even numbered images.)
Allow time for pairs to work and, as they do so, circulate round the room, listening for examples of clear reasoning. After ten minutes or so, it might be appropriate for you to group together two pairs who have been working on the same image so that they have chance to talk as a four about how they used the image, and to rehearse their reasoning.
In the plenary, encourage these groups of four to explain their reasoning, giving the rest of the class the opportunity to chip in and ask questions. You could also invite any pair who had created their own different approach to tall the whole class about it.
Ideally, in a follow-up lesson, you could use the Fruity Totals interactivity to generate other versions of the same problem so that learners have the opportunity to practise the methods.
Key questions
If you could work out the value of the square/hexagon/circle/triangle, how could you then work out the value of the triangle/circle/hexagon/square?
What can you deduce by comparing (for example) the bottom two rows?
Possible extension
Using the Fruity Totals interactivity, can students work out how much information is necessary to solve the problems uniquely, and identify redundant information?
Possible support
The problem could be solved by trial and improvement, so suggest students choose a value for a particular shape and explore the consequences. While this strategy makes the task accessible, by sharing different methods, the idea is to move learners on to more sophisticated approaches.
You may also like
Geoboards
This practical challenge invites you to investigate the different squares you can make on a square geoboard or pegboard.