Skip over navigation


Parabolic Patterns
Age 14 to 18
Challenge Level 

Try sketching the graph of $y=x^2$ on paper. What would you expect
the graph of $y=-x^2$ to look like? What is the effect of the minus
sign? Is this one of the graphs in the picture?
What would you expect the graph of $y=(x-4)^2$ to look like? How would you expect the graph of $y=x^2$ to be transformed to give the graph of $y=(x-4)^2$?
What about $y=-(x-4)^2$?
Draw the graphs of these functions using graph drawing software or a graphics calculator if you have access to one or the other. Were your predictions right?
What have you learnt from this example about reflections and translations of graphs and the corresponding equations of the functions?
Now experiment with drawing the graphs of other functions and see if you can find the equations for all the graphs in the picture.
You may also like
Cubic Spin
Prove that the graph of f(x) = x^3 - 6x^2 +9x +1 has rotational symmetry. Do graphs of all cubics have rotational symmetry?
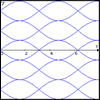
Sine Problem
In this 'mesh' of sine graphs, one of the graphs is the graph of the sine function. Find the equations of the other graphs to reproduce the pattern.
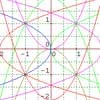
More Parabolic Patterns
The illustration shows the graphs of twelve functions. Three of them have equations y=x^2, x=y^2 and x=-y^2+2. Find the equations of all the other graphs.