Skip over navigation


A tree diagram is simply a way of representing a sequence of events. Tree diagrams are particularly useful in probability since they record all possible outcomes in a clear and uncomplicated manner.
Let's take a couple of examples back to first principles and see if we can gain a deeper insight into tree diagrams and their use for calculating probabilities.
Example:
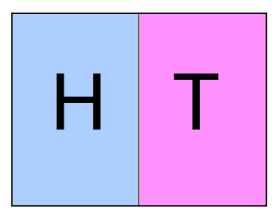
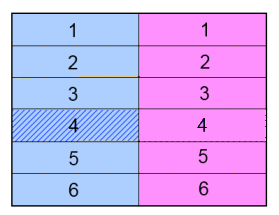
Let's take a look at a simple example, flipping a coin and then rolling a die. We might want to know the probability of getting a Head and a 4.
If we wanted, we could list all the possible outcomes:
"Or" Means Add
Now let's consider the probability of getting a Head or a 4.
We are using the word "or" in its mathematical sense to mean "Head or 4 or both", as opposed to the common usage which often means "either a Head or a 4":
So P(H or 4) is $\frac{7}{12}$
Again, we can work this out from the tree diagram, by selecting every branch which includes a Head or a 4:
Each of the ticked branches shows a way of achieving the desired outcome. So P(H or 4) is the sum of these probabilities:
$P(H\text{ or }4) = P(H,4) + P(H, \text{ not }4 ) + P(T, 4) = \frac{1}{12} + \frac{5}{12} + \frac{1}{12} = \frac{7}{12}$.
So this is why Joe said that you add down the ends of the branches.
Picturing the Probabilities
Imagine I roll an ordinary die three times, and I'm interested in the probability of getting one, two or three sixes.
I might draw a tree diagram like this:
Check that you agree with the probabilities at the end of each branch before reading on.
We can now work out:
I hope this article helps you to understand what's happening next time you come across a tree diagram, and that it helps you to construct your own tree diagrams to solve problems.
Click here for a selection of NRICH problems where tree diagrams can be used.

An Introduction to Tree Diagrams
What is a Tree Diagram?
A tree diagram is simply a way of representing a sequence of events. Tree diagrams are particularly useful in probability since they record all possible outcomes in a clear and uncomplicated manner.
First principles
Let's take a couple of examples back to first principles and see if we can gain a deeper insight into tree diagrams and their use for calculating probabilities.
Example:
Let's take a look at a simple example, flipping a coin and then rolling a die. We might want to know the probability of getting a Head and a 4.
If we wanted, we could list all the possible outcomes:
(H,1) (H,2) (H,3) (H,4) (H,5) (H,6)
(T,1) (T,2) (T,3) (T,4) (T,5) (T,6)
Probability of getting a Head and a 4:
P(H,4) = $\frac{1}{12}$
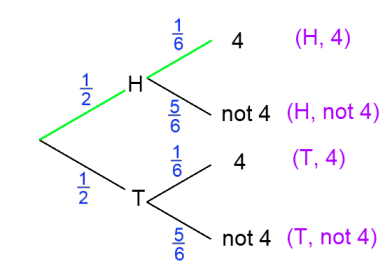
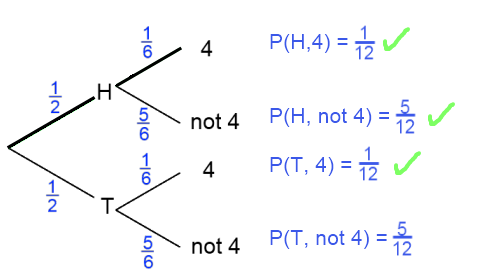
Here is one way of representing the situation using a tree diagram. To save time, I have chosen not to list every possible die throw (1, 2, 3, 4, 5, 6) separately, so I have just listed the outcomes "4" and "not 4":
Each path represents a possible outcome, and the fractions indicate the probability of travelling along that branch. For each pair of branches the sum of the probabilities adds to 1.
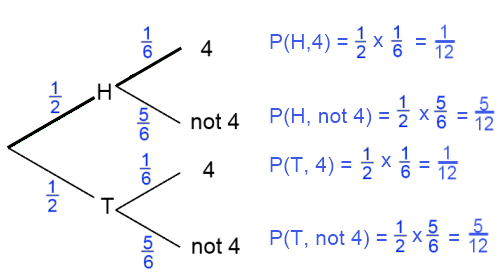
"And" Means Multiply
So how might we work out P(H,4) from the tree diagram? We could word this as the probability of getting a Head and then a 4. This is the green path.
Half the time, I expect to travel along the first green branch.
Then, on one sixth of those occasions, I will also travel along the second green branch. We can think of this as $\frac{1}{6} \text{ of } \frac{1}{2}$.
$\frac{1}{6} \text{ of } \frac{1}{2} = \frac{1}{6}$ x $\frac{1}{2} = \frac{1}{12}$
So this is why Joe said that you multiply across the branches of the tree diagram.
"And" only means multiply if events are independent, that is, the outcome of one event does not affect the outcome of another. This is certainly true for our example, since flipping the coin has no impact on the outcome of the die throw.
"Or" Means Add
Now let's consider the probability of getting a Head or a 4.
We are using the word "or" in its mathematical sense to mean "Head or 4 or both", as opposed to the common usage which often means "either a Head or a 4":
(H,1) (H,2) (H,3) (H,4) (H,5) (H,6) (T,4)
So P(H or 4) is $\frac{7}{12}$
Again, we can work this out from the tree diagram, by selecting every branch which includes a Head or a 4:
Each of the ticked branches shows a way of achieving the desired outcome. So P(H or 4) is the sum of these probabilities:
$P(H\text{ or }4) = P(H,4) + P(H, \text{ not }4 ) + P(T, 4) = \frac{1}{12} + \frac{5}{12} + \frac{1}{12} = \frac{7}{12}$.
So this is why Joe said that you add down the ends of the branches.
Picturing the Probabilities
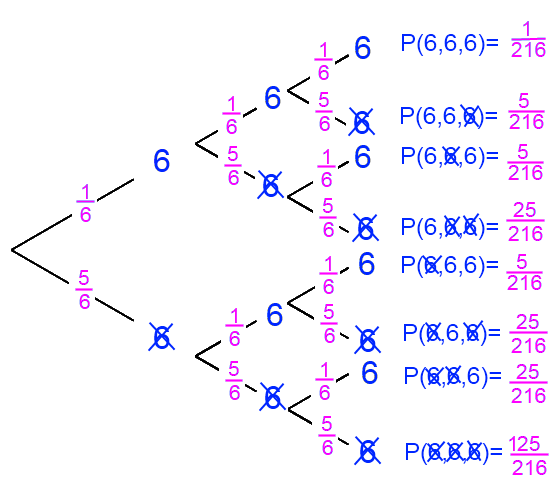
Imagine I roll an ordinary die three times, and I'm interested in the probability of getting one, two or three sixes.
I might draw a tree diagram like this:
Check that you agree with the probabilities at the end of each branch before reading on.
We can now work out:
P(three sixes) = $\frac{1}{216}$
P(exactly two sixes) = $\frac{15}{216}$
P(exactly one six) = $\frac{75}{216}$
P(no sixes) = $\frac{125}{216}$
P(exactly two sixes) = $\frac{15}{216}$
P(exactly one six) = $\frac{75}{216}$
P(no sixes) = $\frac{125}{216}$
Again, check that you understand where these probabilities have come from before reading on.
To really check your understanding, think about the outcomes that contribute to each of the probabilities on the tree diagram. For example, P(6, not 6, 6) is $\frac{5}{216}$, because out of the 216 total outcomes there are five outcomes which satisfy (6, not 6, 6):
6, 1, 6
6, 2, 6
6, 3, 6
6, 4, 6
6, 5, 6
Can you explain why there are 25 outcomes that satisfy (not 6, not 6, 6)?
What about the other probabilities on the tree diagram?
I hope this article helps you to understand what's happening next time you come across a tree diagram, and that it helps you to construct your own tree diagrams to solve problems.
Click here for a selection of NRICH problems where tree diagrams can be used.
You may also like
Master Minding
Your partner chooses two beads and places them side by side behind a screen. What is the minimum number of guesses you would need to be sure of guessing the two beads and their positions?
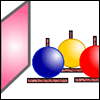
In a Box
Chris and Jo put two red and four blue ribbons in a box. They each pick a ribbon from the box without looking. Jo wins if the two ribbons are the same colour. Is the game fair?
Chances Are
Which of these games would you play to give yourself the best possible chance of winning a prize?