P Is for Posing
One of the joys of working with young learners is their seemingly never-ending thirst for knowledge. In this article we'll explore ways to satisfy their curiosity using data handling activities, some of which are included in our Primary curriculum mapping document.
We suggest following a four step data handling model, adapted from the work of Alan Graham (1991), which encourages learners to pose their own problems. Although posing questions and being curious are highly desirable characteristics of young mathematicians (Kilpatrick et al., 2001), we also know that the curiosity levels of learners often decreases as they progress through their schooling (Knuth, 2002). Data handling activities are an ideal vehicle for valuing the curiosity of our learners by investigating their ideas.
Step One: Posing the question
Using an engaging context is a useful way to prompt learners to suggest questions which they can investigate for themselves. Questions tend to come thick and fast at this step, but do try to value them all; mathematician Dan Meyer notes that recording ideas on an easel or the board can act as such a useful 'hook' that some learners will not be satisfied until they have found out the answers! Healthy Snack Shop encourages this approach by giving children the opportunity to set up a class 'tuck shop'. In Going for Gold young learners are challenged to consider problem-posing through the context of sport.
Step Two: Collecting the data
Before hunting out your clipboards, do take a moment to explore the possibilities of existing data sets. We've got curriculum-linked data about journeys to school in Real Statistics and pet data in The Domesday Project, and both activities feature detailed teachers' resources and examples of classroom work to support planning. If the World were a Village is another activity using an existing data source, based on David Smith's book. Each of these activities encourages young learners to pose their questions, interpret data and communicate their findings.
When young learners pose their own questions, the close relationship between those questions and the data they'll need to collect becomes increasingly apparent. For example, asking 'Who is the fastest runner?' may lead to some very straightforward data collection. In contrast, asking 'Who is the best runner?' may lead to animated discussions about the meaning of 'best'.
Step Three: Presenting the data
There's a wealth of ways for young learners to present their data including tables, bar graphs, pie charts, histograms, pictograms, Venn diagrams and Carroll diagrams (the latter are named after Lewis Carroll - a prominent mathematician as well as a famous children's author).
For very young learners, our highly interactive Sticky Data task offers a lovely introduction to presenting data in a very accessible way. Ladybird Count is a great activity for encouraging them to consider different ways of presenting the same data. For slightly older learners How Big Are Classes 5, 6 and 7? offers a
similar opportunity. Encouraging young learners to develop their data handling fluency by experiencing different ways to present data and reflecting on their choices, can support them to choose the most appropriate approach for their own data as their skills develop. When Florence Nightingale realised that her detailed tables of the casualty numbers in the Crimean War was
insufficient to prompt action among MPs, she turned towards a visual representation which not only stirred MPs but also led to the development of modern statistics. To learn more about her innovations, our colleagues at Plus have written this article and there's a child-friendly version on our Wild Maths site.

Nightingale's famous polar area diagrams: Diagram of the causes of mortality in the army in the east.
If comparing different ways of presenting data can help our classes to develop their data handling fluency, then one of the most under-exploited approaches is using Venn diagrams despite numerous mentions in curriculum guidance notes (DfE, 2013). Venn diagrams are ideal for developing sorting skills, they require careful thinking about different ways to categorise shapes, numbers and so on. They can also vary enormously - encouraging learners to explore different categories can also lead to some surprising Venn diagram layouts. Too often, learners are presented with uninspiring Venn diagrams featuring two sets which fail to challenge their thinking even though there's a wealth of Venn diagrams available to explore. Our interactive Carroll Diagrams and Venn Diagrams offer you the chance to tailor the numerical content to suit your learners.
What's more, we can take things further by encouraging our learners to explore the relationship between Venn and Carroll diagrams. This question, taken from the 2009 KS2 Mathematics Test B, inspired us to create a new task:
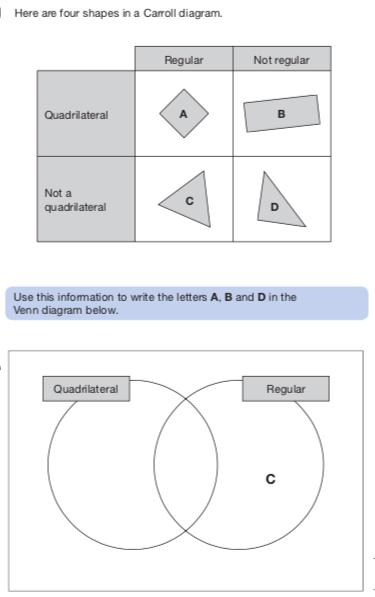
In Data Duos, learners are encouraged to consider different ways to sort a selection of 2D shapes, then they are invited to match the Venn and Carroll diagrams which show the same way of sorting.
Step four: Answering the question
Having collected their data and presented their findings, answering their question may or may not be straightforward. Interpreting graphs is a key data literacy skill. Sometimes, learners might be able to read their answer from the graph, but often more work is needed. At NRICH, our curriculum-linked activites feature examples of classroom work in the 'Solutions' tab. These solutions can be used in several ways, including encouraging learners to compare their answers with those on NRICH.
Of course, once they've found an answer to their original question, it may prompt them to ask new questions and the data handling cycles starts over again...
References
Department for Education (DfE). (2013). National curriculum in England: Framework document. Retrieved from https://www.gov.uk/government/publications/national-curriculum-in-england-primary-curriculum
Graham, A. (1991). Where is the 'P' in statistics? In D.Pimm and E.Love (Eds), Teaching and learning school mathematics. Hodder and Stoughton Ltd.
Kilpatrick, J. Swafford, J. & Findell, B. (2001). Adding it up: Helping children learn mathematics. National Academies Press.
Knuth, E. (2002). Fostering mathematical curiosity. The Mathematics Teacher, 95(2), 126-130.
Qualifications and Curriculum Authority (2009) Key Stage 2 Mathematics Test B.