Or search by topic
Number and algebra
Geometry and measure
Probability and statistics
Working mathematically
Advanced mathematics
For younger learners
Picturing Square Numbers


- Problem
- Getting Started
- Student Solutions
- Teachers' Resources
Why do this problem?
This problem develops the links between visualisation, verbal description and algebraic representation.
Possible approach
This printable worksheet may be useful: Picturing Square Numbers.
Kick off by talking about odd numbers:
What do the first $10$ odd numbers add up to?
What do the first $5$ odd numbers add up to?
What is the $50$th odd number anyway? The $100$th?
$125$ is an odd number. Which is it?
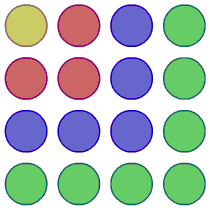
Show students this image or the interactivity

Ask for comments on the arrangement of dots.
"How can this help us explain the relationship between square numbers and the sum of odd numbers?"
"How many more dots will I need to add to make the next square? And the next? And the next?"
"How many more dots will I need to go from the $100$th square to the $101$th?"
Set students off to work in pairs on the questions set in the main body of the problem: Picturing Square Numbers
Key questions
What is the $5$th, $10$th, $455$th odd number?
What is the sum of the first $10$, $20$, $50$, ... $n$ odd numbers?
Possible support
This task could be used as a context for working hard on odd numbers and their structure, practising doubling numbers and mental addition. Tasks could include adding sets of odd numbers, imagining the last layer on the $30$th square, the $57$th square, working out which square would have $43$ as its last layer.
To prepare students for looking closely at other sequence pattern diagrams, the interactivity could support discussion between students - how they imagine the next diagram will look, whether different students see it differently.
Possible extension
A suitable extension task is provided in this worksheet .
For another problem that uses a similar idea go to Picturing Triangle Numbers
You may also like
Is There a Theorem?
Draw a square. A second square of the same size slides around the first always maintaining contact and keeping the same orientation. How far does the dot travel?

