Skip over navigation


For [-0.1, 0.1]
And for [-0.01, 0.01] I have:
 Each of the 4
functions could be approximated using the Taylor series expansion
around 0, and the accuracy of the approximation becomes better for
values of $x$ nearer to the origin. I shall use the second order
polynomial: $$A(x) \approx x,\quad B(x) \approx 1- (1 - x^2/2) =
x^2/2, \quad C(x)\approx x - x^2/2, \quad D(x) \approx - x -
x^2.$$
Each of the 4
functions could be approximated using the Taylor series expansion
around 0, and the accuracy of the approximation becomes better for
values of $x$ nearer to the origin. I shall use the second order
polynomial: $$A(x) \approx x,\quad B(x) \approx 1- (1 - x^2/2) =
x^2/2, \quad C(x)\approx x - x^2/2, \quad D(x) \approx - x -
x^2.$$
What Do Functions Do for Tiny X?
Age 16 to 18
Challenge Level 

Congratulations Andrei for another very good solution.
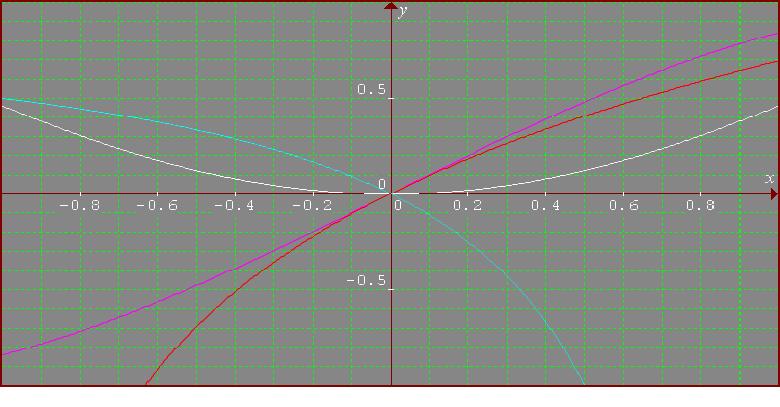
The 4 functions are: $$A(x) = \sin x,\quad B(x) = 1 - \cos x,\quad C(x) = \log (1+x), \quad D(x) = 1- {1\over (1-x)}.$$ I consider the logarithm in base e. First I plotted the 4 functions using Graphmatica. In all figures $A(x)$ is violet, $B(x)$ is white, $C(x)$ is red and $D(x)$ is cyan. For $[-1, 1]$ I obtain:
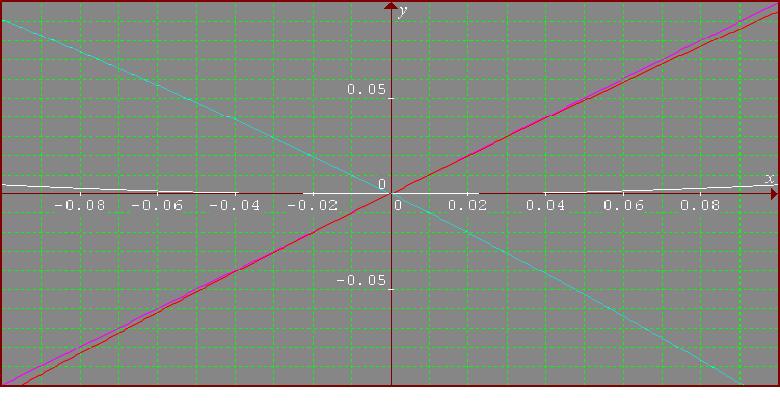
For [-0.1, 0.1]
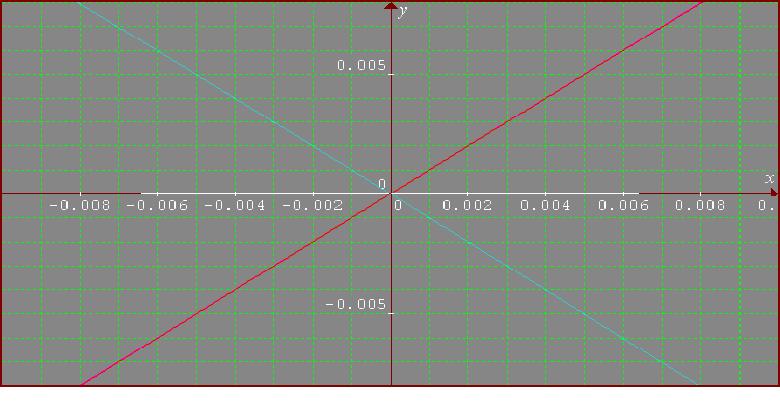
And for [-0.01, 0.01] I have:
Each of the 4
functions could be approximated using the Taylor series expansion
around 0, and the accuracy of the approximation becomes better for
values of $x$ nearer to the origin. I shall use the second order
polynomial: $$A(x) \approx x,\quad B(x) \approx 1- (1 - x^2/2) =
x^2/2, \quad C(x)\approx x - x^2/2, \quad D(x) \approx - x -
x^2.$$You may also like
Towards Maclaurin
Build series for the sine and cosine functions by adding one term at a time, alternately making the approximation too big then too small but getting ever closer.
Taking Trigonometry Series-ly
Look at the advanced way of viewing sin and cos through their power series.